Average Cost of Solar Panels in 2026: Lifespan & ROI Analysis
Analyze the 2026 average cost of solar panels through a durability lens. Compare degradation rates, failure modes, and long-term residential ROI.
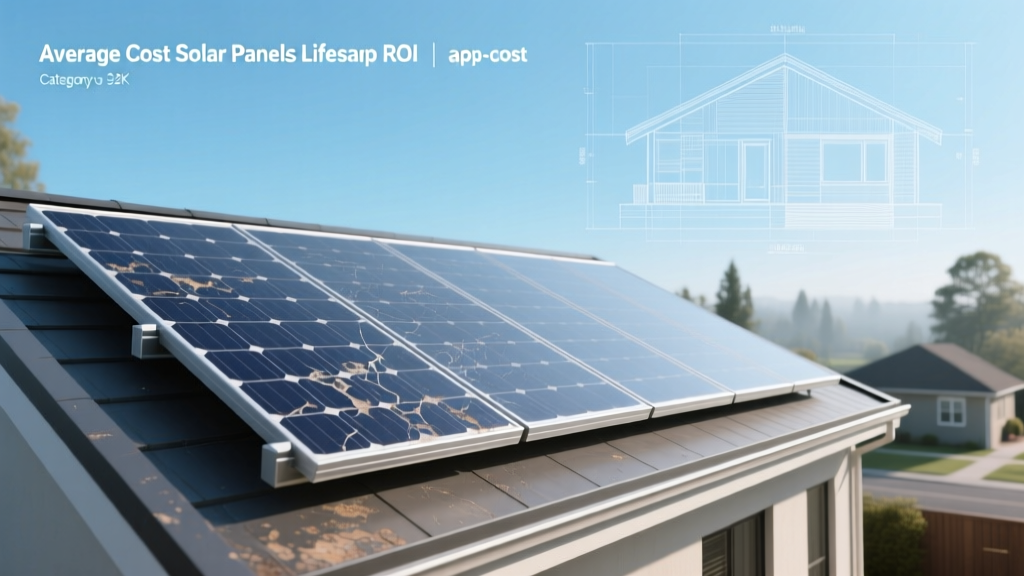
The True Average Cost of Solar Panels (2026 Baseline)
Evaluating the financial viability of a photovoltaic (PV) system requires looking far beyond the initial installation invoice. While homeowners frequently search for the average cost of solar panels to establish a baseline budget, this metric is incomplete without factoring in the system's physical lifespan, annual energy degradation, and component failure rates. A cheaper panel that degrades rapidly or suffers early diode failure will ultimately yield a higher levelized cost of energy (LCOE) than a premium alternative.
According to benchmarking data from the National Renewable Energy Laboratory (NREL), the residential solar market in 2026 has stabilized following supply chain corrections. The current average cost of solar panels for a standard 8kW residential system ranges from $2.65 to $3.35 per watt before federal tax incentives, translating to a gross system cost of $21,200 to $26,800. However, this range masks critical durability distinctions between cell technologies.
- Standard P-Type PERC: $2.45 - $2.70 per watt (Legacy tech, higher degradation)
- N-Type TOPCon: $2.75 - $3.05 per watt (Current market standard, balanced durability)
- N-Type HJT / IBC (Premium): $3.15 - $3.60 per watt (Maximum lifespan, lowest degradation)
Degradation Rates: The Hidden Lifespan Killer
All solar panels lose a fraction of their power generation capacity each year due to ultraviolet exposure, thermal cycling, and microscopic silicon lattice defects. The rate of this degradation dictates the system's true end-of-life output. In 2026, the industry has largely transitioned to N-type silicon wafers for premium and mid-tier panels, which inherently resist light-induced degradation (LID) far better than older P-type wafers.
When calculating the long-term ROI based on the average cost of solar panels, you must apply the manufacturer's median degradation rate to your projected energy production. A panel with a 0.50% annual degradation rate will produce significantly less power in year 20 than one rated at 0.25%, altering the payback period by several years.
| Cell Technology | Typical Brand Examples | Annual Degradation | Year 25 Output Guarantee | Estimated Physical Lifespan |
|---|---|---|---|---|
| P-Type Monocrystalline | Legacy / Budget Imports | 0.45% - 0.55% | 80.0% - 82.0% | 25 - 30 Years |
| N-Type TOPCon | Qcells, Canadian Solar, Trina | 0.35% - 0.40% | 84.0% - 87.0% | 30 - 35 Years |
| N-Type HJT / IBC | Maxeon, REC Alpha, Huasun | 0.25% - 0.30% | 89.0% - 92.0% | 35 - 40+ Years |
Warranty Fine Print vs. Physical Reality
Manufacturers typically offer two distinct warranties: a product warranty (covering physical defects and material failures) and a performance warranty (guaranteeing a minimum power output). Most premium brands now offer a 25-year linear performance warranty and a 15- to 25-year product warranty. However, physical lifespan frequently outlasts the warranty period.
Industry Insight: Research highlighted by the Solar Energy Industries Association (SEIA) indicates that properly installed, high-quality PV modules rarely suffer catastrophic silicon failure before year 30. The limiting factor for system lifespan is almost never the solar cell itself, but rather the degradation of the EVA (ethylene-vinyl acetate) encapsulant, backsheet delamination, and the failure of external power electronics.
Component Failure Modes & Edge Cases
To accurately forecast maintenance costs over the lifespan of your investment, you must understand how and why solar arrays fail. The average cost of solar panels does not include the inevitable replacement of balance-of-system (BOS) components. Here are the primary failure modes encountered in residential arrays:
1. Microinverter and Optimizer Capacitor Degradation
While the silicon panels may last 35 years, module-level power electronics (MLPE) like microinverters (e.g., Enphase IQ8 series) or DC optimizers (e.g., SolarEdge) contain electrolytic capacitors that dry out and fail under constant thermal stress. Expect a 5% to 8% failure rate for MLPE units between years 12 and 18. Replacing a single microinverter costs roughly $150 to $250 in parts and labor, but requires climbing onto the roof and lifting the panel.
2. Potential Induced Degradation (PID)
PID occurs when high voltage potentials between the solar cells and the grounded aluminum frame cause ion migration (usually sodium ions) from the glass into the silicon cell. This can cause power losses of up to 30% if unmitigated. Premium N-type HJT and IBC panels are inherently highly resistant to PID, whereas cheaper P-type modules require specific anti-PID encapsulants and grounded inverter topologies to prevent it.
3. Bypass Diode Burnout
Located in the junction box on the back of the panel, bypass diodes protect shaded cells from overheating. If a panel is consistently partially shaded by a growing tree or new construction, the diodes can overheat, melt the junction box potting compound, and fail open. This results in a total loss of output for that specific cell substring.
4. EVA Encapsulant Yellowing and Delamination
Cheap panels use lower-grade EVA films that lack sufficient UV stabilizers. After 10 to 15 years of intense sun exposure, the EVA yellows, reducing light transmission by 5% to 12%. In extreme thermal climates (like Arizona or Nevada), poor lamination processes can lead to backsheet delamination, allowing moisture ingress that permanently corrodes the silver busbars.
Durability-to-Cost Decision Matrix
How do you choose between a standard TOPCon panel and a premium IBC panel based on the average cost of solar panels? Use this decision framework based on your specific roof architecture and labor constraints.
- Recommendation: N-Type TOPCon (Mid-Tier)
- Rationale: Labor costs for future panel removal and reinstallation (R&R) are low. If a panel fails in year 20, replacing it is relatively inexpensive. The lower upfront cost yields a faster initial ROI.
- Recommendation: N-Type HJT or IBC (Premium)
- Rationale: Scaffold setup and high-angle roof labor are exceptionally expensive. You must minimize the probability of needing to replace panels or microinverters. Paying a 15% premium upfront for Maxeon or REC panels with ultra-low degradation and superior physical durability prevents exorbitant maintenance labor costs later.
- Recommendation: Standard P-Type or Entry-Level N-Type
- Rationale: The panels will need to be uninstalled and reinstalled (R&R) for the new roof anyway. Minimize initial capital expenditure, as the system will be dismantled before long-term degradation heavily impacts output.
Maintenance Costs Over a 30-Year Horizon
When calculating the lifetime value against the average cost of solar panels, factor in these scheduled and unscheduled maintenance milestones. Data from the U.S. Department of Energy confirms that while PV systems have no moving parts, they are not strictly 'install and forget' assets.
- Years 1-10 (The Honeymoon Phase): Minimal costs. Occasional cleaning in arid climates ($150-$250 per visit) if rainfall is insufficient to clear dust and pollen. Visual inspections for rodent damage to wiring.
- Years 10-15 (The Electronics Window): Budget for the replacement of 1 to 3 microinverters or optimizers. If using a central string inverter, expect the primary inverter to require replacement during this window ($1,500 - $2,500 installed).
- Years 15-25 (The Mechanical Check): Inspect mid-clamps, L-feet, and flashing for galvanic corrosion or thermal expansion loosening. Re-torque racking hardware if necessary. Check junction box seals for UV cracking.
- Years 25-30+ (End of Warranty): System is still generating power, but output may drop below the economic threshold if paired with high-degradation panels. At this stage, evaluate the cost of decommissioning versus continuing to run the array at reduced efficiency.
Ultimately, the average cost of solar panels is merely the entry ticket to a 30-year energy partnership. By prioritizing N-type cell architectures, scrutinizing the EVA encapsulant quality, and aligning your panel tier with your roof's physical complexity, you secure a system that delivers reliable, low-degradation power for decades beyond its official warranty expiration.