How Much Does It Cost to Build an Apartment Complex? Regional Guide
Discover how much it costs to build an apartment complex across US regions, including hard costs, soft costs, and 2026 material variables.

The Core Question: How Much Does It Cost to Build an Apartment Complex?
When developers ask how much does it cost to build a apartment complex, the answer requires splitting the budget into typology multipliers. The structural system dictates the baseline hard costs before regional labor and material variances are applied.
| Building Typology | Stories | Primary Structural System | 2026 Cost per Sq Ft (National Avg) | Cost per Unit (Est. 1,200 sq ft) |
|---|---|---|---|---|
| Garden / Low-Rise | 1 - 3 | Wood-frame on concrete slab | $175 - $240 | $210,000 - $288,000 |
| Mid-Rise (Podium) | 4 - 6 | Concrete podium + wood/steel frame | $240 - $320 | $288,000 - $384,000 |
| High-Rise | 7+ | Post-tensioned concrete / Steel | $350 - $500+ | $420,000 - $600,000+ |
The Mass Timber Shift in Mid-Rise Construction
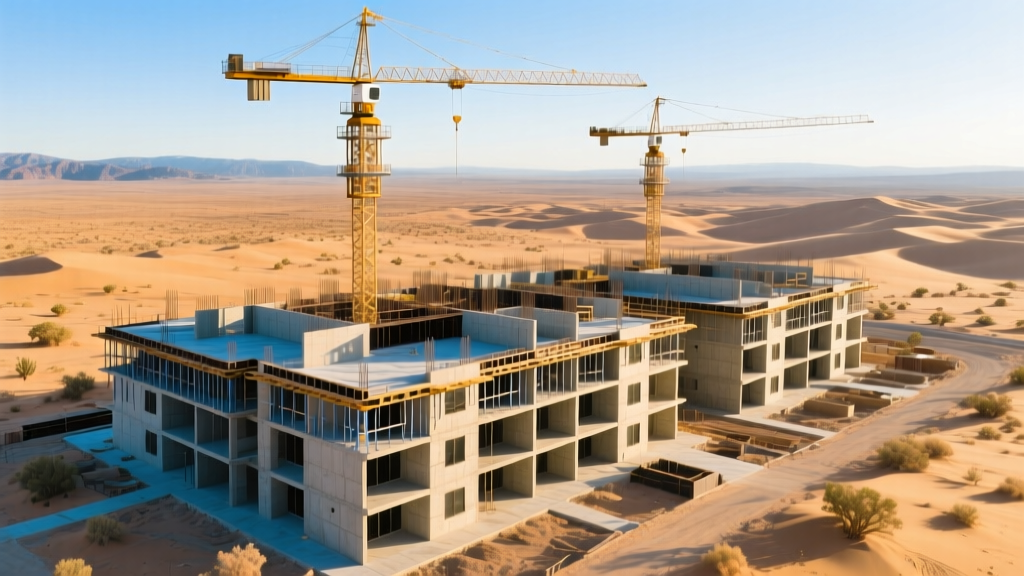
As of 2026, Cross-Laminated Timber (CLT) has captured significant market share in the 4-to-8-story mid-rise sector. While CLT material costs remain 8-12% higher than traditional concrete podiums, the reduction in crane time, smaller crew requirements, and accelerated dry-in schedules reduce overall project timelines by 15-20%. This time-savings directly offsets the material premium by reducing construction loan interest carry costs.
Regional Price Analysis: The 5 Major US Construction Zones
Geography is the most volatile variable in multifamily estimating. Below is a breakdown of regional cost drivers based on current Bureau of Labor Statistics Producer Price Index data and regional building code enforcement realities.
1. The Northeast (NY, MA, PA, NJ)
- Cost Multiplier: 1.35x - 1.50x National Average
- Primary Drivers: Prevailing wage and union labor dominance in major metros. Deep frost lines require extensive foundation work, often necessitating helical piles or deep concrete footings below 48 inches.
- Code Nuance: Strict adherence to localized energy codes (e.g., NYC Local Law 97 equivalents) requires high-performance building envelopes and commercial-grade VRF HVAC systems, adding $12-$18 per sq ft to MEP budgets.
2. The Southeast (FL, GA, NC, TX)
- Cost Multiplier: 0.85x - 1.05x National Average
- Primary Drivers: Open-shop labor markets keep wages competitive. However, coastal and southern Florida projects face severe material premiums for hurricane mitigation.
- Code Nuance: Miami-Dade Notice of Acceptance (NOA) impact-rated glazing and reinforced concrete masonry unit (CMU) ground floors can increase facade and framing costs by 22% compared to inland wood-frame equivalents.
3. The Midwest (IL, OH, MI, MN)
- Cost Multiplier: 0.90x - 1.10x National Average
- Primary Drivers: Lowest baseline material and labor costs in the country. The primary financial risk is weather-related schedule compression.
- Code Nuance: Extreme freeze-thaw cycles mandate high-psi air-entrained concrete mixes and rigorous thermal bridging mitigation in the building envelope to meet IECC 2024 energy standards.
4. The Southwest (AZ, NV, NM)
- Cost Multiplier: 1.00x - 1.15x National Average
- Primary Drivers: Expansive clay soils dominate regions like the Phoenix basin. Standard slab-on-grade foundations are insufficient; engineers frequently specify drilled concrete piers or post-tensioned slabs, adding $8-$14 per sq ft to site work.
- Code Nuance: Extreme heat loads require oversized HVAC tonnage and high-SHGC (Solar Heat Gain Coefficient) low-E window glazing to prevent peak-utility demand penalties.
5. The West Coast (CA, WA, OR)
- Cost Multiplier: 1.40x - 1.75x National Average
- Primary Drivers: The highest soft costs in the nation. Environmental review processes (like CEQA in California) can add 18-36 months of pre-development holding costs before a shovel hits the dirt.
- Code Nuance: Seismic design categories D and E require expensive steel moment frames, specialized shear walls, and base isolators for high-rises. Title 24 energy mandates also force the inclusion of rooftop solar PV arrays and mandatory EV charging infrastructure in parking podiums.
Deconstructing the Budget: Hard Costs vs. Soft Costs
According to U.S. Census Bureau Construction Spending reports and industry benchmarks, a typical 2026 multifamily budget allocates capital across three main buckets. Understanding this split is critical for securing accurate construction-to-permanent financing.
Hard Costs (65% - 75% of Total Budget)
These are the physical, tangible costs of construction. They are generally fixed once the Guaranteed Maximum Price (GMP) contract is signed with the General Contractor.
- Sitework & Foundations (10-15%): Grading, utility tie-ins, retaining walls, and concrete foundations.
- Superstructure & Framing (20-25%): Wood, steel, or concrete framing, including floor decks and roof systems.
- Building Envelope (12-18%): Exterior cladding (fiber cement, brick veneer, EIFS), roofing membranes, and fenestration.
- MEP Rough-in & Trim (18-22%): Mechanical, electrical, plumbing, fire suppression sprinklers, and low-voltage data wiring.
- Interior Finishes (15-20%): Drywall, LVP flooring, quartz countertops, cabinetry, and appliance packages.
Soft Costs (15% - 25% of Total Budget)
Non-physical expenses required to execute the project. The National Association of Home Builders (NAHB) notes that soft costs have inflated faster than hard costs over the last three years due to rising insurance premiums and architectural engineering fees.
- Architectural & Engineering (A&E): 5% - 8% of hard costs.
- Permitting & Impact Fees: 2% - 12% (highly region-dependent).
- Construction Loan Interest & Insurance: 4% - 7% (subject to current SOFR rates and builder's risk premiums).
- Legal, Marketing, & Lease-up: 2% - 4%.
Land Acquisition (10% - 15% of Total Budget)
Land basis varies wildly. A teardown site in a Tier-1 urban core may consume 25% of the total project capitalization, whereas raw land on the urban fringe of a Sunbelt metro might represent only 8% of the total development cost.
Strategic Sourcing to Mitigate Regional Variance
Developers building across multiple regions must adapt their procurement strategies to protect margins against localized supply chain bottlenecks.
Pro-Tip for 2026 Procurement: If building in the Pacific Northwest or Northeast, lock in structural steel and CLT timber contracts 9-12 months prior to groundbreaking. Regional fabrication backlogs for engineered mass timber frequently exceed 40 weeks in these high-demand zones.
For interior finishes, national developers are increasingly utilizing direct-to-site containerized shipping for FF&E (Furniture, Fixtures, and Equipment). By bypassing regional distributor markups in high-cost states like California and New York, development teams can shave 10-15% off the interior trim and appliance budget. Standardizing unit layouts across regions allows for bulk purchasing of exact SKU quantities—such as specific 3cm quartz countertop profiles and standardized 36-inch induction ranges—creating economies of scale that offset regional labor premiums.
Final Feasibility Checklist
Before moving from conceptual estimating to schematic design, ensure your pro forma accounts for the following regional edge cases:
- Utility Capacity Fees: Verify local water and sewer tap fees. In rapidly growing Sunbelt municipalities, sewer capacity buy-ins can unexpectedly add $8,000+ per unit.
- Prevailing Wage Triggers: If your capital stack includes LIHTC (Low-Income Housing Tax Credits) or municipal bond financing, Davis-Bacon prevailing wage laws will apply, instantly increasing labor costs by 20-35% in open-shop regions.
- Parking Ratios: Suburban zones may mandate 1.5 to 2.0 parking spaces per unit. Building structured parking podiums costs between $25,000 and $45,000 per stall in 2026, drastically altering the site yield and overall cost-per-unit metrics.
Written by
Priya KapoorPriya Kapoor is a real estate market analyst and construction economics researcher with expertise in housing affordability, development feasibility, and infrastructure investment. She holds a Master of Regional Planning from Cornell University and previously worked as a senior analyst at CBRE's Investment Properties group, where she modeled returns for $4B in mixed-use development pipelines. Priya now runs an independent research practice advising developers, municipalities, and REITs on construction cost forecasting and market timing. She publishes the quarterly "BuildMat Market Pulse" report tracking material price indices across 12 commodity categories. Based in Austin, TX, Priya serves on the board of Habitat for Humanity Austin and is a marathon runner.
More from Priya Kapoor
View all
Construction Cost
Cost to Build a 1600 Sq Ft Home in 2026: Full Breakdown
Accurate 2026 cost to build a 1600 sq ft home—material, labor, and regional pricing breakdowns included. Plan your budget with real-time estimates.
Aug 11, 2026
Wood & Lumber
Name the Types of Wood for Pressure Treatment and Preservation
Learn how to name the types of wood best suited for pressure treatment. Compare species treatability, chemical retention levels, and 2026 preservation costs.
Aug 4, 2026
Stone & Masonry
Stone Veneer Suppliers Lindenhurst: 2026 Cost Analysis
Analyze 2026 stone veneer costs in Lindenhurst, NY. Compare local supplier pricing, delivery fees, and Suffolk County installation labor rates.
Aug 4, 2026