Cost to Build a Solar Farm in 2026: Utility vs Community
Compare the cost to build a solar farm in 2026. Detailed breakdown of utility-scale vs. community-scale pricing, equipment, and land requirements.

The Economics of Solar Development in 2026
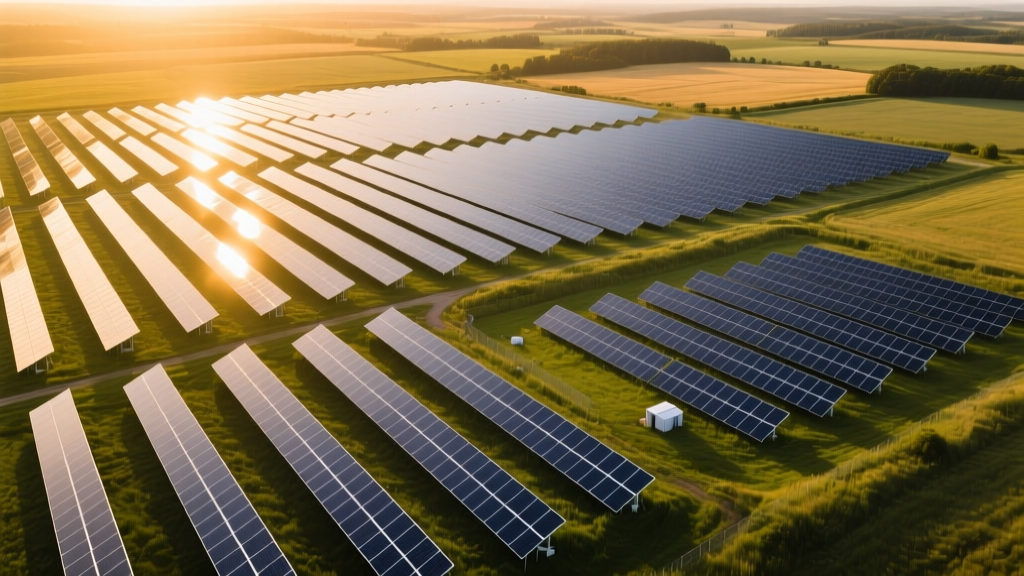
Determining the exact cost to build a solar farm requires moving beyond generic per-watt averages. In 2026, the solar EPC (Engineering, Procurement, and Construction) landscape is defined by stabilized module pricing but elevated balance-of-system (BOS) costs, driven by persistent high-voltage transformer shortages and prevailing wage mandates under the Inflation Reduction Act (IRA). Developers must now weigh the economies of scale inherent in 50MW+ utility projects against the faster permitting and localized grid integration of 1MW to 5MW community solar arrays.
According to the National Renewable Energy Laboratory (NREL) Annual Technology Baseline, the capital expenditure (CAPEX) gap between utility and commercial/community scales has narrowed slightly due to supply chain optimizations in mid-tier racking and string inverter technologies. However, the fundamental cost architecture remains distinctly different.
Utility-Scale vs. Community-Scale: The Macro Comparison
The following matrix contrasts the baseline capital requirements for a standard 50MW utility-scale facility utilizing single-axis tracking against a 3MW community-scale fixed-tilt array, both situated in a Tier-2 solar market (e.g., North Carolina or Illinois).
| Metric | 50MW Utility-Scale (Tracking) | 3MW Community-Scale (Fixed-Tilt) |
|---|---|---|
| Total Estimated CAPEX | $52,500,000 - $58,000,000 | $4,500,000 - $5,100,000 |
| Cost per Watt (DC) | $1.05 - $1.16 / W | $1.50 - $1.70 / W |
| Land Requirement | 250 - 300 Acres | 12 - 15 Acres |
| Grid Interconnection | Transmission/Substation (High Upgrade Risk) | Distribution Feeder (Lower Upgrade Risk) |
| Annual O&M | $12 - $16 / kW-year | $18 - $22 / kW-year |
While utility-scale benefits from a 30% to 40% discount on per-watt hardware costs, the soft costs—specifically environmental impact studies, transmission-level interconnection studies, and multi-year development timelines—add significant carrying costs before ground is even broken.
Component-Level Cost Breakdown (50MW Utility Baseline)
To accurately forecast your budget, you must isolate the primary hardware categories. For a 50MW DC utility project, the hardware and direct labor allocation typically follows this distribution:
1. PV Modules: $0.24 - $0.32 per Watt
Utility developers in 2026 are heavily favoring bifacial TOPCon (Tunnel Oxide Passivated Contact) modules or thin-film alternatives. The First Solar Series 7 (CdTe thin-film) remains a dominant choice for utility projects due to its superior temperature coefficient and domestic manufacturing tax credits, pricing around $0.28/W. Alternatively, bifacial PERC/TOPCon modules from manufacturers like Canadian Solar (e.g., BiHiKu7) offer higher nameplate efficiency, allowing for tighter row spacing and reduced land lease costs.
2. Inverters: $0.04 - $0.07 per Watt
The choice between central and string inverters drastically alters both upfront costs and long-term O&M. Central inverters (e.g., SMA Sunny Central 4000-EV) cost roughly $0.04/W and require dedicated, climate-controlled inverter pads. String inverters (e.g., Huawei SUN2000-350KTL) cost closer to $0.06/W but eliminate the need for centralized combiner boxes and reduce downtime, as a single string failure does not take down a 2MW block.
3. Racking and Tracking: $0.14 - $0.19 per Watt
Single-axis trackers like the Nextracker NX Horizon-XTR are standard for utility farms, optimizing yield by 15% to 25% compared to fixed-tilt. However, they require rigorous geotechnical surveys. If your site features expansive clay soils or high wind shear zones (e.g., West Texas), foundation costs for helical piles or driven H-beams can increase racking installation costs by up to 22%.
Pad-mounted and substation transformers remain the most severe bottleneck in 2026. Lead times for 50MVA+ step-up transformers from suppliers like Hitachi Energy or Siemens frequently exceed 70 weeks. Failing to secure transformer allocation during the early design phase will result in millions in delayed tax credit monetization and PPA (Power Purchase Agreement) penalties.
The Hidden Cost Multiplier: Grid Interconnection
Hardware costs are predictable; grid interconnection costs are not. According to SEIA market research, network upgrade costs assigned to developers in regional transmission organization (RTO) queues like PJM and MISO have skyrocketed.
- Distribution-Level (Community Scale): Interconnecting a 3MW project to a local 12kV or 34kV distribution feeder typically costs $80,000 to $250,000 for minor upgrades (e.g., reclosers, thicker conductors). Lead time: 8-14 months.
- Transmission-Level (Utility Scale): A 50MW project connecting to a 115kV+ substation may trigger system impact studies requiring the developer to fund capacitor banks, relay upgrades, or entirely new switchyards. These costs routinely range from $1.5M to $8M+, with queue wait times spanning 3 to 5 years.
Fixed-Tilt vs. Single-Axis Tracking Yield Matrix
Choosing your mounting architecture dictates both your initial capital outlay and your Levelized Cost of Energy (LCOE). The data below models a 10MW project in a high-irradiance zone (e.g., Pinal County, Arizona).
| Architecture | CAPEX (per Watt) | First-Year Yield (MWh/MW) | Land Required (Acres/MW) | Estimated LCOE |
|---|---|---|---|---|
| Fixed-Tilt (Optimized Azimuth) | $0.92 | 1,650 MWh | 4.2 Acres | $38 / MWh |
| Single-Axis Tracking (True North-South) | $1.08 | 1,980 MWh | 5.5 Acres | $34 / MWh |
While single-axis tracking increases upfront CAPEX by roughly 17% and requires 30% more land to prevent inter-row shading, the 20% boost in energy capture during peak morning and evening hours aligns better with modern Time-of-Use (TOU) PPA pricing structures, ultimately lowering the LCOE. For comprehensive LCOE modeling methodologies, developers should consult the NREL LCOE analysis frameworks.
Site Selection & Soft Cost Variables
Beyond hardware, site-specific variables will dictate your final budget variance:
- Topography and Grading: A site with a slope greater than 3 degrees requires extensive cut-and-fill grading. Earthmoving can add $40,000 to $80,000 per MW to site prep costs.
- Security and Fencing: Utility farms mandate 7-foot chain-link fencing with anti-climb tops and wildlife exclusion barriers at the base. Budget $18 to $25 per linear foot for installed perimeter security.
- Prevailing Wage Compliance: To secure the full 30% base Investment Tax Credit (ITC) plus the 10% domestic content bonus, EPC contractors must pay Davis-Bacon prevailing wages. This increases direct labor costs by 15% to 25% compared to open-market rates, but the resulting tax equity leverage heavily outweighs the labor premium.
Actionable Framework: Choosing Your Farm Scale
Use this decision matrix to determine which solar farm model aligns with your capital and risk tolerance:
- Pursue Utility-Scale (20MW+) if: You have access to $10M+ in development capital, possess a high risk tolerance for multi-year interconnection queue delays, and have secured a long-term PPA with a utility or corporate off-taker.
- Pursue Community-Scale (1MW - 5MW) if: You want to bypass transmission-level interconnection queues, prefer faster deployment (12-18 months from inception to COD), and plan to monetize the project through localized community solar subscription models or virtual net metering (VNM) tariffs.
Accurate cost estimation in 2026 demands granular attention to supply chain lead times and regulatory compliance. By isolating hardware, soft costs, and grid upgrade liabilities, developers can build financial models that withstand the realities of modern solar deployment.
Written by
Marcus ChenMarcus Chen is a licensed structural engineer (PE) and building materials analyst with over 12 years of experience across residential, commercial, and industrial construction. He holds a Master of Science in Civil Engineering from UC Berkeley and spent six years at Thornton Tomasetti before transitioning to independent consulting and technical writing. Marcus specializes in material selection for seismic-prone regions, concrete reinforcement strategies, and lifecycle cost analysis. His work has been cited by the American Concrete Institute (ACI) and the Structural Engineers Association of California (SEAOC). When he is not on a job site or at his desk, you will find him hiking the Sierra Nevada or restoring a 1920s craftsman bungalow in Oakland, CA.
More from Marcus Chen
View all
Construction Cost
How Much Did the Eiffel Tower Cost to Build?
How much did the Eiffel Tower cost to build in 1889? We adjust for inflation and compare its budget to modern skyscraper construction.
Aug 4, 2026

Fire Resistance
What Is a Fire Resistant Material? Testing & Certification Guide
Discover what is a fire resistant material through ASTM and UL testing. Learn how fire ratings, certifications, and assemblies work in construction.
Aug 4, 2026

Construction Cost
How Much Did the Burj Khalifa Cost to Build?
How much did the Burj Khalifa cost to build? We break down the $1.5B project and extract 5 money-saving strategies for your next build.
Jul 30, 2026