Average Cost to Build a House 2025 vs 2026 Regional Price Guide
Compare the average cost to build a house 2025 vs 2026. Explore regional price analysis, material shifts, and labor rates across US markets.

The Shift from 2025 to 2026: National Baselines
The national average cost to build a house 2025 settled at approximately $165 per square foot for standard builder-grade construction on a flat lot, excluding land acquisition. However, analyzing this national average masks severe regional bifurcations that are accelerating into 2026. According to the National Association of Home Builders (NAHB), construction costs are no longer driven purely by material commodities; they are increasingly dictated by localized energy codes, union labor density, and municipal impact fees.
As we move through 2026, the U.S. Census Bureau Construction Spending data indicates a 4.2% national year-over-year increase in residential building costs. Yet, this growth is highly asymmetric. Sunbelt markets are seeing cost stabilization due to non-union labor availability and slab-on-grade foundations, while Northeastern and West Coast markets are experiencing 7% to 9% surges driven by stringent seismic retrofitting mandates and IECC 2021 energy code adoptions.
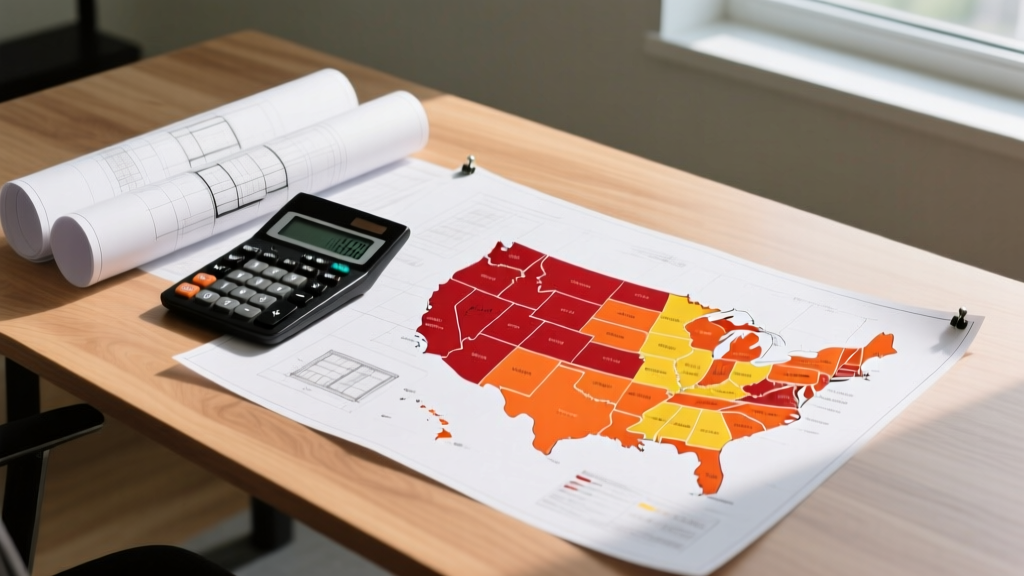
Regional Cost Matrix: Per-Square-Foot Breakdown
The following matrix isolates the projected 2026 cost per square foot against the established 2025 baseline, highlighting the primary cost drivers unique to each Census region.
| Region | 2025 Baseline (Cost/Sq Ft) | 2026 Projected (Cost/Sq Ft) | Primary Cost Driver |
|---|---|---|---|
| Northeast | $185 | $198 | Union labor, full basements, strict energy codes |
| South | $145 | $152 | Land development, hurricane strapping, insurance |
| Midwest | $155 | $162 | Frost walls, weather-delayed concrete pours |
| West | $195 | $215 | Seismic engineering, water mitigation, high land costs |
The Foundation Skew: Why Regional Averages Mislead
When evaluating the average cost to build a house 2025 vs 2026, failing to account for foundation typology leads to massive budget miscalculations. A 2,500-square-foot home in Florida and a 2,500-square-foot home in Massachusetts have fundamentally different structural cost profiles.
Slab-on-Grade vs. Full Basement Economics
In the South, over 85% of new builds utilize slab-on-grade foundations. A 2,500 sq ft footprint requires roughly 85 cubic yards of 3000 PSI concrete, costing between $120 and $135 per yard, totaling roughly $11,500 for the pour, plus $4,500 for site prep and rebar. Total foundation cost: ~$16,000.
Conversely, in the Northeast and Midwest, frost lines dictate full basements or deep crawlspace foundations. A 1,250 sq ft footprint (yielding 1,250 sq ft of main living space and 1,250 sq ft of unfinished basement) requires 4000 PSI air-entrained concrete for frost walls and a reinforced floor slab. At $145 to $160 per cubic yard, plus extensive excavation, waterproofing (e.g., Tremco Paraseal membrane), and backfill, the foundation cost easily exceeds $45,000. This $29,000 delta artificially inflates the per-square-foot metric in northern states when calculated against total finished living space.
Material Volatility: Lumber Grades and Concrete Mixes
Commodity pricing is regionalized. Framing lumber in the South heavily relies on #2 Southern Yellow Pine (SYP), which has stabilized around $420 to $450 per thousand board feet (MBF) entering 2026. In contrast, West Coast builders depend on Douglas Fir-Larch (DF-L), currently tracking between $510 and $550 per MBF. This 20% material premium directly impacts the framing budget, adding roughly $3,500 to $5,000 to the shell cost of a standard 2,200 sq ft home in California compared to Texas.
Furthermore, structural sheathing choices are diverging by climate zone. In high-wind and high-moisture regions (Southeast coastal, Pacific Northwest), builders are increasingly abandoning traditional OSB and Tyvek housewrap in favor of integrated structural panels like the Huber ZIP System. While ZIP System sheathing adds approximately $1.50 to $2.00 per square foot to the material budget, it reduces framing labor time by 12% to 14% by eliminating the separate weather-resistive barrier installation step, ultimately neutralizing the cost premium while vastly reducing moisture-related callback risks.
Energy Code Deltas: IECC 2021 vs 2018
The adoption of the International Energy Conservation Code (IECC) 2021 creates a hidden regional tax. States enforcing IECC 2021 (like New Jersey, Washington, and parts of California) mandate continuous exterior insulation (ci) and R-49 attic insulation. Applying 1.5-inch Owens Corning Foamular NGX rigid foam to the exterior of a 2,500 sq ft home adds $4,500 to $6,500 in material and specialized fastener costs. States still operating on IECC 2018 or older (like Missouri or Alabama) bypass this continuous insulation requirement entirely, saving thousands per build.
Labor Rate Disparities and Union vs. Non-Union Markets
Labor accounts for 40% to 50% of total construction costs, and the Bureau of Labor Statistics Employment Cost Index highlights stark geographic divides. In heavily unionized markets (Illinois, New York, Washington), prevailing wages for skilled carpenters and electricians range from $45 to $65 per hour, factoring in burden and benefits. In right-to-work Sunbelt states (Texas, Florida, Georgia), non-union framing crews operate at $22 to $32 per hour.
Expert Insight: When calculating labor budgets, do not just look at the hourly wage. In high-cost coastal markets, contractors must factor in a 15% to 20% 'commute and parking premium' for subcontractors traveling from affordable inland suburbs to coastal job sites, a cost that is entirely absent in decentralized Sunbelt metro areas.
Warning: The Hidden Regional Tax of Impact Fees
Municipal impact fees, utility hookups, and permitting costs vary wildly and are rarely included in national per-square-foot averages. In California, average impact fees exceed $23,000 per single-family lot, with some Bay Area municipalities charging over $40,000. In contrast, comparable fees in Texas and North Carolina frequently fall below $4,000. Always query the local municipal building department for the exact 'residential single-family impact fee schedule' before finalizing your land-to-build budget.
HVAC and Mechanical Sizing by Climate Zone
Mechanical costs are entirely dictated by DOE climate zones. A 2,400 sq ft home in Climate Zone 2 (Miami) requires a high-SEER cooling focus. Builders must install a minimum 15 SEER2 system, often necessitating two 2-ton units to handle latent humidity loads, costing roughly $14,000 to $18,000. In Climate Zone 5 (Chicago), the focus shifts to heating. A 96% AFUE modulating gas furnace paired with a standard 14 SEER2 AC unit and a whole-home ERV (Energy Recovery Ventilator) to meet fresh air mandates will cost between $11,000 and $14,000. Failing to run an accurate Manual J load calculation specific to the zip code will result in either massive upfront overages or post-construction comfort failures.
Actionable Framework: Adjusting Your Budget by Zip Code
To translate the average cost to build a house 2025 into an accurate 2026 localized budget, follow this sequential adjustment framework:
- Establish the Baseline: Start with the national median of $165/sq ft for standard finishes.
- Apply the Foundation Multiplier: If building in the Midwest/Northeast (full basement), add $25/sq ft to the footprint cost. If in the South (slab), subtract $5/sq ft.
- Factor the Code Premium: Check your state's IECC adoption. If enforcing 2021 or newer, add $8 to $12 per square foot of exterior wall area for continuous insulation and advanced air sealing (e.g., AeroBarrier).
- Adjust for Labor Density: If your county has a union labor prevalence above 20%, increase your framing, plumbing, and electrical line items by 25%.
- Query Local Impact Fees: Call the county clerk or check the municipal website for exact utility tap and school impact fees, adding this as a hard line item to your site-work budget.
By deconstructing the national average and applying these regional multipliers, you transition from relying on misleading macroeconomic statistics to utilizing a precise, localized construction estimating model.
Written by
Priya KapoorPriya Kapoor is a real estate market analyst and construction economics researcher with expertise in housing affordability, development feasibility, and infrastructure investment. She holds a Master of Regional Planning from Cornell University and previously worked as a senior analyst at CBRE's Investment Properties group, where she modeled returns for $4B in mixed-use development pipelines. Priya now runs an independent research practice advising developers, municipalities, and REITs on construction cost forecasting and market timing. She publishes the quarterly "BuildMat Market Pulse" report tracking material price indices across 12 commodity categories. Based in Austin, TX, Priya serves on the board of Habitat for Humanity Austin and is a marathon runner.
More from Priya Kapoor
View all
Construction Cost
Cost to Build a 1600 Sq Ft Home in 2026: Full Breakdown
Accurate 2026 cost to build a 1600 sq ft home—material, labor, and regional pricing breakdowns included. Plan your budget with real-time estimates.
Aug 11, 2026

Wood & Lumber
Name the Types of Wood for Pressure Treatment and Preservation
Learn how to name the types of wood best suited for pressure treatment. Compare species treatability, chemical retention levels, and 2026 preservation costs.
Aug 4, 2026
Stone & Masonry
Stone Veneer Suppliers Lindenhurst: 2026 Cost Analysis
Analyze 2026 stone veneer costs in Lindenhurst, NY. Compare local supplier pricing, delivery fees, and Suffolk County installation labor rates.
Aug 4, 2026