How Much Does It Cost to Build a Hydroelectric Power Plant?
Discover how much it costs to build a hydroelectric power plant. Get a detailed cost breakdown of civil works, turbines, and grid interconnection expenses.

The True Capital Cost: Dollars per Kilowatt
Estimating the capital expenditure (CAPEX) for a hydroelectric facility requires moving beyond generic square-footage metrics used in commercial real estate. Hydropower economics are dictated by fluid dynamics, geology, and grid topology. When analyzing how much it costs to build a hydroelectric power plant, engineers and financial modelers rely on the metric of dollars per installed kilowatt ($/kW). According to the National Renewable Energy Laboratory (NREL) Annual Technology Baseline, new utility-scale hydropower CAPEX currently ranges from $3,200 to $5,500 per kW, heavily dependent on site-specific head (vertical drop) and flow rate characteristics.
- Large-Scale (>10 MW): $2,800 – $4,500 per kW (Benefits from economies of scale in civil works)
- Small-Scale (1 MW – 10 MW): $4,000 – $6,500 per kW (Higher per-unit electro-mechanical costs)
- Micro-Hydro (<1 MW): $6,000 – $10,000+ per kW (Limited by off-the-shelf component availability)
These figures represent total installed costs, encompassing everything from initial geological surveys to the final grid synchronization. However, a lump-sum $/kW metric obscures the mechanical and civil realities of the project. To build an accurate financial model, the budget must be disaggregated into four primary cost centers.
Detailed Cost Breakdown by Project Phase
The allocation of capital shifts dramatically based on whether the project is a run-of-river installation (which diverts a portion of the river without a large reservoir) or an impoundment facility (which relies on a massive dam to create a reservoir). The table below outlines the standard CAPEX distribution for a conventional 20 MW impoundment project.
| Cost Category | % of Total CAPEX | Est. $/kW Range | Primary Cost Drivers |
|---|---|---|---|
| Civil Works & Site Prep | 45% - 55% | $1,400 - $2,800 | Dam construction, spillways, penstocks, powerhouse excavation |
| Electromechanical Equipment | 25% - 35% | $800 - $1,800 | Turbines, generators, governors, switchgear, transformers |
| Grid Interconnection | 5% - 10% | $200 - $500 | Transmission lines, substations, SCADA systems |
| Soft Costs & Permitting | 10% - 15% | $350 - $750 | FERC licensing, environmental impact studies, engineering design |
Civil Works: Concrete, Earth, and Steel
Civil works represent the most capital-intensive and geologically risky phase of construction. For impoundment dams, Roller-Compacted Concrete (RCC) is the modern standard, costing approximately $160 to $240 per cubic yard installed, significantly faster and cheaper than conventional vibrated concrete. Embankment dams utilizing local rock-fill and clay cores can reduce material costs but require massive earthmoving operations.
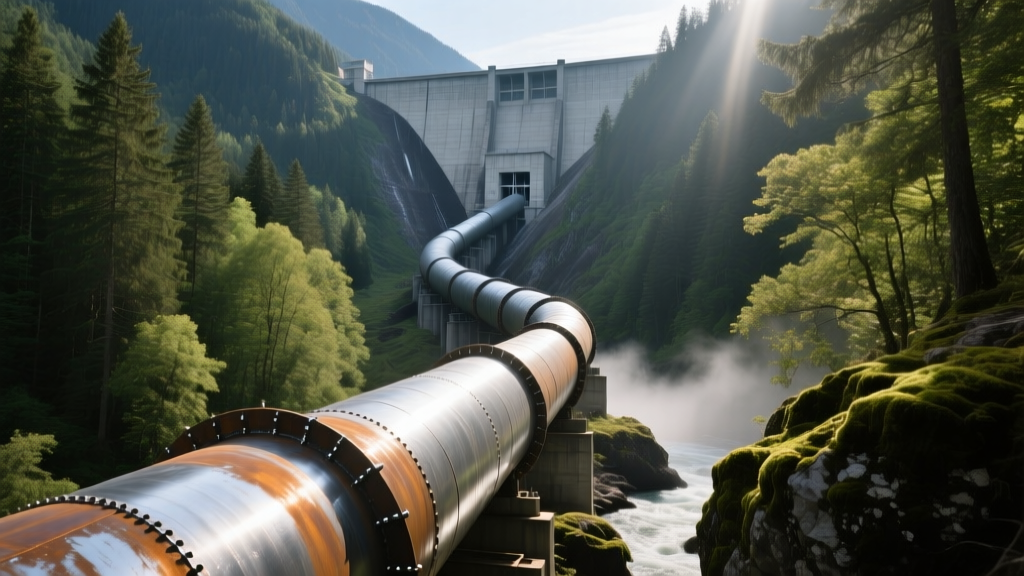
The penstock—the pressurized pipeline delivering water to the turbine—is another major variable. For low-to-medium head applications (under 150 meters), Fiberglass Reinforced Plastic (FRP) or High-Density Polyethylene (HDPE) pipes cost between $150 and $350 per linear foot. For high-head applications exceeding 300 meters, engineers must specify welded carbon steel penstocks with specialized interior linings to prevent cavitation and corrosion, driving costs to $800 – $1,500+ per linear foot.
Electromechanical Equipment Selection
Turbine selection is strictly dictated by the site's hydraulic profile. Selecting the wrong turbine type results in catastrophic efficiency losses and accelerated runner erosion. According to the U.S. Department of Energy's Water Power Technologies Office, matching the turbine to the specific head and flow is the most critical engineering decision in the project lifecycle.
- Pelton Wheel (Impulse): Best for High Head (>300m) / Low Flow. Features multiple nozzles and split buckets. Cost Premium: Moderate, but requires expensive high-pressure steel penstocks.
- Francis Turbine (Reaction): Best for Medium Head (30m - 300m) / Medium Flow. The most common turbine globally. Cost Premium: Baseline. Highly efficient (up to 94%) but sensitive to flow variations.
- Kaplan Turbine (Reaction): Best for Low Head (<30m) / High Flow. Features adjustable runner blades and wicket gates. Cost Premium: 15% - 25% higher than Francis due to complex internal blade-pitch hydraulics.
Generators also impact the budget. Synchronous generators are required for grid-forming capabilities and black-start services, costing roughly 20% to 30% more than induction generators, which are typically reserved for micro-hydro or strictly grid-following applications.
Hidden Costs: Permitting, Environmental, and Grid Interconnection
Developers frequently underestimate soft costs and interconnection delays. In the United States, securing a license from the Federal Energy Regulatory Commission (FERC) is a grueling process that typically spans 3 to 7 years. Comprehensive environmental impact studies—including fish passage engineering, sediment transport modeling, and downstream flow regime analysis—can easily consume $750,000 to $2.5 million before a single cubic yard of concrete is poured.
Grid interconnection presents another financial bottleneck. A 20 MW facility generating power at 13.8 kV requires a step-up transformer and a dedicated switchyard to connect to a regional 115 kV transmission line. If the nearest viable interconnection node is five miles away, constructing a dedicated 115 kV transmission corridor will add $500,000 to $1.2 million per mile to the CAPEX, drastically altering the project's viability.
Financial Modeling and the LCOE Advantage
While the upfront CAPEX of a hydroelectric plant is substantially higher than solar PV or onshore wind, the financial analysis must account for the Levelized Cost of Energy (LCOE) and asset lifespan. Data from the International Renewable Energy Agency (IRENA) consistently demonstrates that hydropower offers the lowest LCOE among all renewable technologies over a 50-year lifecycle, frequently falling below $0.04 per kWh.
Expert Insight on OPEX: Unlike solar arrays that degrade by 0.5% annually and require inverter replacements every 15 years, a well-maintained hydroelectric facility experiences virtually no generation degradation. Civil structures routinely operate for 80 to 100 years, and electromechanical overhauls are only required every 25 to 30 years, resulting in an industry-leading capacity factor often exceeding 55%.
Furthermore, modern hydro plants provide essential grid ancillary services. The ability to dispatch power on demand, provide voltage support, and offer synthetic inertia to stabilize grid frequency allows plant owners to secure premium Power Purchase Agreements (PPAs) and participate in capacity markets, revenue streams that intermittent renewables cannot reliably access without massive, cost-prohibitive battery storage additions.
Strategic Takeaways for Developers
Accurately forecasting how much it costs to build a hydroelectric power plant requires a phased approach to estimating. Developers should allocate 8% to 12% of the total projected CAPEX strictly for front-end engineering design (FEED) and geotechnical investigations. Skimping on subsurface drilling or hydrological flow duration curves inevitably leads to change orders during the civil construction phase, which historically cause the most severe budget overruns in hydropower development. By rigorously matching turbine technology to the hydraulic profile and securing early interconnection queue positions, developers can mitigate the primary financial risks inherent in utility-scale water power infrastructure.
Written by
Marcus ChenMarcus Chen is a licensed structural engineer (PE) and building materials analyst with over 12 years of experience across residential, commercial, and industrial construction. He holds a Master of Science in Civil Engineering from UC Berkeley and spent six years at Thornton Tomasetti before transitioning to independent consulting and technical writing. Marcus specializes in material selection for seismic-prone regions, concrete reinforcement strategies, and lifecycle cost analysis. His work has been cited by the American Concrete Institute (ACI) and the Structural Engineers Association of California (SEAOC). When he is not on a job site or at his desk, you will find him hiking the Sierra Nevada or restoring a 1920s craftsman bungalow in Oakland, CA.
More from Marcus Chen
View all
Construction Cost
How Much Did the Eiffel Tower Cost to Build?
How much did the Eiffel Tower cost to build in 1889? We adjust for inflation and compare its budget to modern skyscraper construction.
Aug 4, 2026

Fire Resistance
What Is a Fire Resistant Material? Testing & Certification Guide
Discover what is a fire resistant material through ASTM and UL testing. Learn how fire ratings, certifications, and assemblies work in construction.
Aug 4, 2026

Construction Cost
How Much Did the Burj Khalifa Cost to Build?
How much did the Burj Khalifa cost to build? We break down the $1.5B project and extract 5 money-saving strategies for your next build.
Jul 30, 2026