Asphalt vs Concrete Parking Lot Cost Analysis: 2026 Specs & ROI
Comprehensive asphalt vs concrete parking lot cost analysis for 2026, detailing material specs, CapEx, OpEx, and 40-year lifecycle ROI for commercial sites.
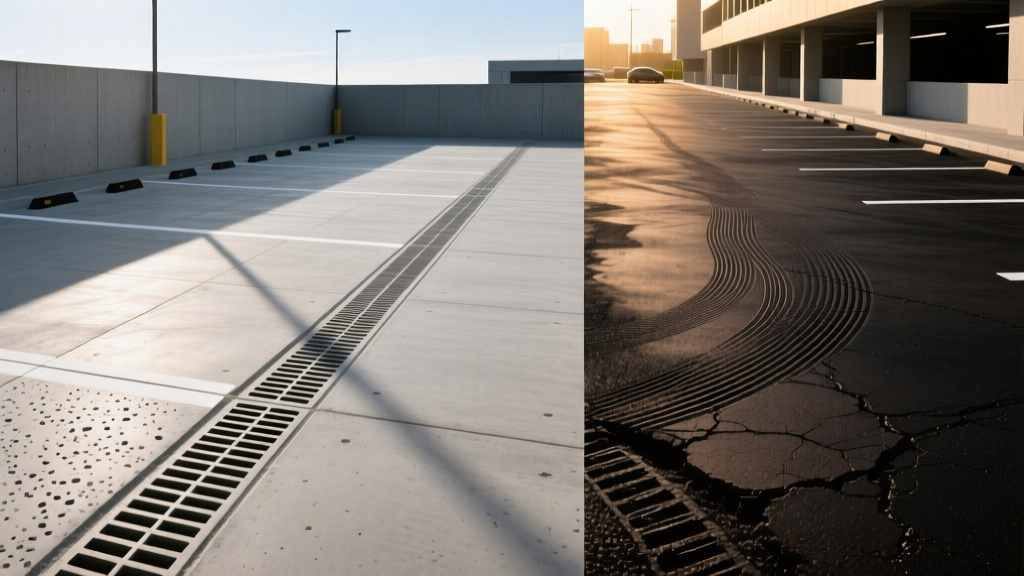
Executive Summary: The 50-Year Lifecycle Reality
The Bottom Line: While asphalt delivers a 30-40% lower initial capital expenditure (CapEx), concrete achieves a lower Net Present Value (NPV) over a 40-year lifecycle due to minimal operational expenditure (OpEx). The optimal choice depends entirely on your site's heavy-vehicle traffic volume, subgrade soil plasticity, and capital amortization timeline.
Conducting a rigorous asphalt vs concrete parking lot cost analysis requires moving beyond simple per-square-foot installation quotes. Commercial facility managers and civil engineers must evaluate structural design requirements, material degradation curves, and maintenance intervals. In 2026, volatile bitumen pricing and stabilized Portland cement supply chains have narrowed the initial cost gap, making lifecycle cost analysis (LCCA) the definitive metric for commercial paving projects.
Material Specifications & Structural Design Requirements
The structural integrity of any parking facility relies on precise material engineering and subgrade preparation. Comparing the two materials requires an apples-to-apples look at their technical specifications.
Concrete Mix Designs & Slab Thickness
Commercial concrete parking lots require high-durability mix designs to resist deicing salts and point-loads from vehicle jacks or delivery trucks.
- Compressive Strength: Minimum 4,000 PSI (28-day cure), with 4,500 PSI specified for truck lanes and loading docks.
- Slab Thickness: 6 inches for standard passenger vehicle zones; 8 inches for fire lanes, garbage truck pads, and loading docks.
- Air Entrainment: 4% to 7% to provide freeze-thaw resistance in northern climates.
- Joint Spacing: Transverse and longitudinal joints spaced at 12 to 15 feet (roughly 2x the slab thickness in inches) to control shrinkage cracking.
- Subbase: 4 to 6 inches of compacted Class 2 Aggregate Base (CAB) over a stabilized subgrade.
Hot Mix Asphalt (HMA) Binders & Lift Thickness
Asphalt is a flexible pavement system that distributes loads laterally. Its performance is dictated by the Performance Graded (PG) binder and aggregate interlock.
- Binder Grade: PG 64-22 for moderate climates; PG 70-22 (polymer-modified) for high-stress areas or regions with extreme summer heat to prevent rutting.
- Lift Thickness: Typically 3 to 4.5 inches total. Applied as a 2-inch to 3-inch base course (larger aggregate) and a 1.5-inch surface wearing course (finer aggregate).
- Subbase: 8 to 12 inches of crushed aggregate base is mandatory, as asphalt relies heavily on the underlying base for structural support.
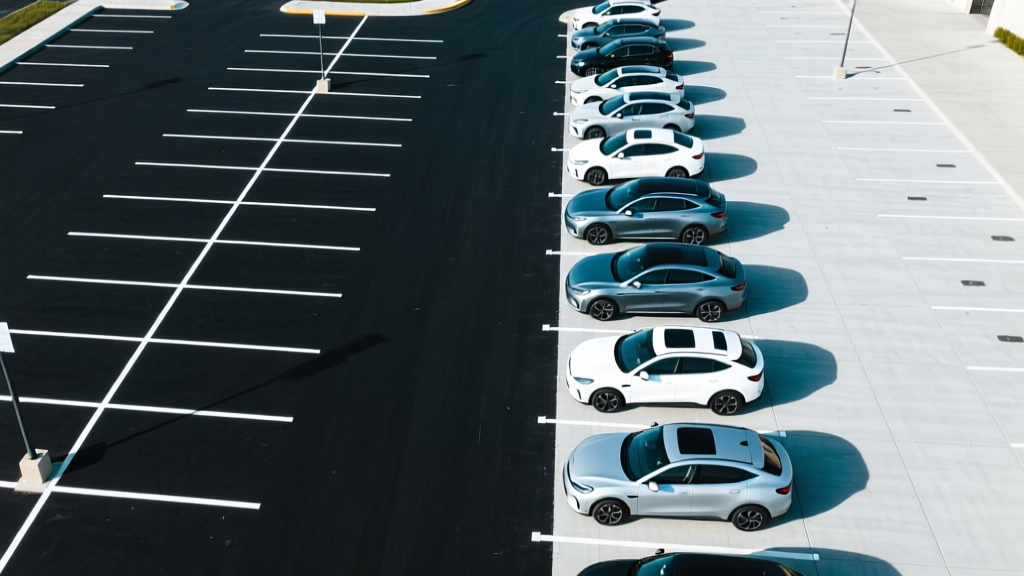
Initial Capital Expenditure (CapEx) Breakdown
Based on 2026 national averages for commercial paving contractors, the initial installation costs reflect material, labor, equipment, and subgrade preparation. These figures assume a standard 50,000 sq. ft. commercial lot with moderate earthwork.
| Cost Component | Concrete (per sq. ft.) | Asphalt (per sq. ft.) |
|---|---|---|
| Earthwork & Grading | $1.20 - $1.80 | $1.50 - $2.20 (requires deeper excavation for thicker aggregate base) |
| Aggregate Subbase | $0.90 - $1.30 | $1.40 - $1.90 |
| Material & Paving Labor | $5.50 - $7.50 | $2.80 - $4.10 |
| Jointing / Striping & Curing | $0.60 - $0.90 | $0.25 - $0.45 |
| Total Installed CapEx | $8.20 - $11.50 | $5.95 - $8.65 |
Edge Case Warning: If your geotechnical report indicates highly expansive clay soils (Plasticity Index > 25), asphalt will require expensive soil stabilization (lime or cement treatment) or a geogrid reinforcement layer. In these scenarios, the CapEx gap between asphalt and concrete narrows significantly, often tipping the financial scale toward rigid concrete pavements.
Operational Expenditure (OpEx) & Maintenance Intervals
The divergence in lifecycle costs occurs in years 5 through 40. Asphalt requires cyclical surface treatments, while concrete requires targeted joint maintenance. According to the Federal Highway Administration's Life-Cycle Cost Analysis guidelines, failing to account for preventative maintenance intervals results in a 40% underestimation of asphalt's true lifecycle cost.
Asphalt Maintenance Timeline
- Years 1-3: Minimal maintenance. Monitor for early transverse cracking.
- Years 3-5 (and every 4 years thereafter): Coal tar or asphalt emulsion sealcoating ($0.20 - $0.35 per sq. ft.). This is non-negotiable to prevent UV oxidation and water infiltration into the aggregate base.
- Years 7-10: Crack sealing ($1.50 - $2.50 per linear foot) to prevent base saturation.
- Year 15-20: Mill and overlay (2 inches) required to restore ride quality and fix surface rutting ($3.50 - $5.00 per sq. ft.).
Concrete Maintenance Timeline
- Years 1-5: Zero scheduled maintenance. Concrete cures and gains strength over time.
- Years 5-7 (and every 7-10 years thereafter): Joint sealant replacement. Routing and sealing contraction joints with hot-pour silicone ($2.00 - $3.00 per linear foot) prevents incompressible materials (rocks/debris) from entering joints and causing spalling.
- Years 20-30: Potential mudjacking or slab replacement for isolated panels experiencing subgrade washout (affects < 2% of total lot area typically).
Net Present Value (NPV) & Lifecycle Cost Analysis
To accurately compare the two, we apply a 4% discount rate over a 40-year analysis period, a standard methodology endorsed by the American Concrete Pavement Association (ACPA) for commercial facility planning. This model assumes a 50,000 sq. ft. lot.
| Financial Metric (40-Year Horizon) | Concrete Parking Lot | Asphalt Parking Lot |
|---|---|---|
| Initial CapEx | $450,000 | $325,000 |
| PV of Preventative Maintenance | $38,000 | $145,000 |
| PV of Major Rehabilitation (Overlays) | $0 | $195,000 |
| Residual Value at Year 40 | +$85,000 | +$20,000 |
| Total Net Present Cost | $403,000 | $645,000 |
The Synthesis: While asphalt saves $125,000 on day one, the concrete parking lot yields a net savings of over $240,000 in present-value dollars by year 40. If the property owner plans to hold the asset for more than 12 years, concrete is the mathematically superior investment.
Environmental & Site-Specific Decision Framework
Beyond pure financial modeling, site-specific variables dictate material viability. Use this technical decision tree to finalize your specification:
- Choose Concrete If:
- The lot services heavy static loads (e.g., garbage truck staging, shipping container drop zones, fire truck access). Asphalt will rut and deform under prolonged static point-loads in high temperatures.
- The site is in an urban heat island zone. Concrete's high albedo (solar reflectance index of 35-50) reduces surface temperatures by up to 15°F compared to asphalt, lowering adjacent building cooling loads and meeting municipal stormwater thermal pollution regulations.
- Nighttime security is a priority. Concrete reflects overhead LED lighting 3x better than asphalt, allowing for lower-wattage light fixtures and improved CCTV clarity.
- Choose Asphalt If:
- The project requires immediate opening. Asphalt can bear full traffic loads within 24 hours of compaction and cooling. Concrete requires 7 days of curing for standard vehicles and 28 days for heavy trucks.
- The budget is strictly constrained by immediate CapEx limits, and the holding period for the real estate asset is under 10 years.
- The site features complex, tight-radius curves or utility access hatches that require frequent trenching and patching. Asphalt patching is seamless and cheap; concrete utility cuts require full-panel saw-cutting and replacement.
Hybrid Specification Strategy: For large-scale commercial developments (e.g., retail centers or logistics hubs), the optimal 2026 approach is a hybrid design. Specify 8-inch reinforced concrete for loading docks, fire lanes, and dumpster pads where point-loads and chemical spills (like hydraulic fluid, which dissolves asphalt binder) are prevalent. Use 4-inch HMA asphalt for standard passenger parking stalls to optimize initial capital deployment.
Written by
Sarah WhitfieldSarah Whitfield is a chartered quantity surveyor (MRICS) and construction cost analyst with 15 years of experience in material pricing, procurement strategy, and project budgeting. She earned her degree in Construction Management from the University of Reading (UK) and has worked on projects ranging from $2M custom homes to $180M mixed-use developments across North America and Europe. Sarah currently leads cost estimating for BuildMat Insight, maintaining a proprietary database of 4,000+ material price points updated quarterly. She is a frequent contributor to RSMeans cost data panels and has presented at the International Cost Engineering Council (ICEC) congress. Based in Denver, CO, Sarah is an avid trail runner and volunteer mentor for Women in Construction.
More from Sarah Whitfield
View all
Wood & Lumber
What Are the Different Types of Wood? A Builder's Guide
Compare structural softwoods, finish hardwoods, and engineered lumber. Analyze Janka ratings, MOE values, and 2026 pricing for construction.
Aug 4, 2026
Walls & Panels
Steel Framing vs Wood Framing: Corrosion and Moisture Defense
Compare steel framing vs wood framing for moisture resistance. Learn about galvanized coatings, condensation risks, and corrosion protection strategies.
Jul 21, 2026

Stone & Masonry
How to Cut Stone Veneer: Wet Saw vs Grinder Comparison
Compare the best tools for cutting stone veneer. We review wet saws, angle grinders, and chop saws to help you achieve clean, chip-free cuts.
Jul 21, 2026